The DMap Viewer
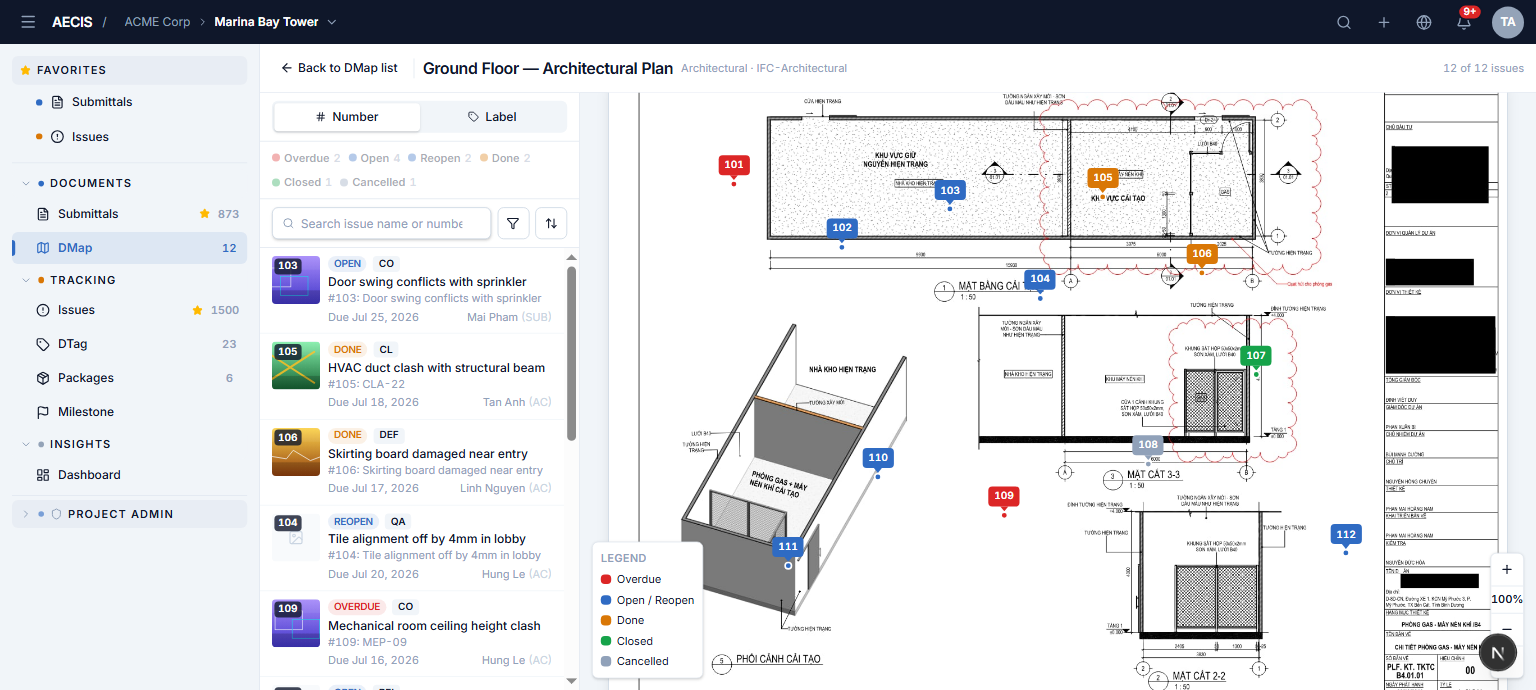
Click a DMap's name in the list to open the full-page viewer: the drawing canvas with pins on the right, the issue panel on the left.
Header
← Back to DMap list returns to the register. The title shows the drawing's name, discipline, and drawing set; a Filtered badge appears when a filter is active; an issue count shows "N of M issues".
Pan & zoom
- Pan — click and drag anywhere on the canvas.
- Zoom — mouse wheel, or the zoom cluster at the bottom-right: [+], the current percentage, [−], and [Fit]. Range 50–400%; the viewer opens at 100%, and Fit resets zoom to 100% and re-centers the drawing.
Pins
Each linked issue appears as a pin at its recorded position: a label box in the status color (showing the issue number), a connector triangle, and an anchor dot marking the exact spot. Pin positions are stored as percentages of the drawing, so they stay accurate at any zoom.
- View mode toggle (top of the left panel) — Number shows the issue number on each pin; Label shows the pin's custom label (e.g.
COL-01), falling back to the number. - Status legend — the card at the bottom-left explains the colors: red Overdue, blue Open/Reopen, amber Done, green Closed, grey Cancelled.
- When active filters match no pins, an amber banner appears — "No issues match the current filters on this drawing" — with a Clear link.
note
Pins reflect the state at page load. If an issue changes elsewhere in the app, reload the page to see the updated pins.