Status Charts & Filters
The Submittals and Issues cards share the same chart layout:
- Header — the title, an "N total" count (caption only, not clickable), and a filter funnel (a dot appears when a filter is active).
- Donut — one slice per status, color-coded, with the total in the center. Clicking a slice drills into the module list filtered by that status.
- Legend — compact colored dots each showing its count. Hover a dot for the full status name, count, and share; click it for the same drill as the slice.
- Lifecycle stacked bar (footer) — three equal-width segments: Inactive (red), Active (amber), Closed (green), with the count in white inside each. Hover Inactive for its meaning: no movement for 7+ days.
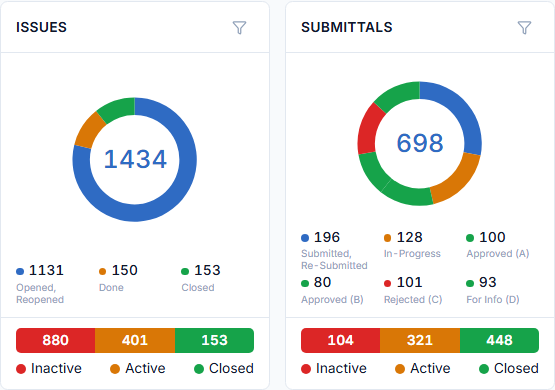
:::note What the Submittal donut counts The Submittal donut counts every status except Draft — a draft is pre-workflow, so it appears in neither the donut nor the stacked bar. :::
Filtering a chart
Each chart has its own filter, opened by the funnel:
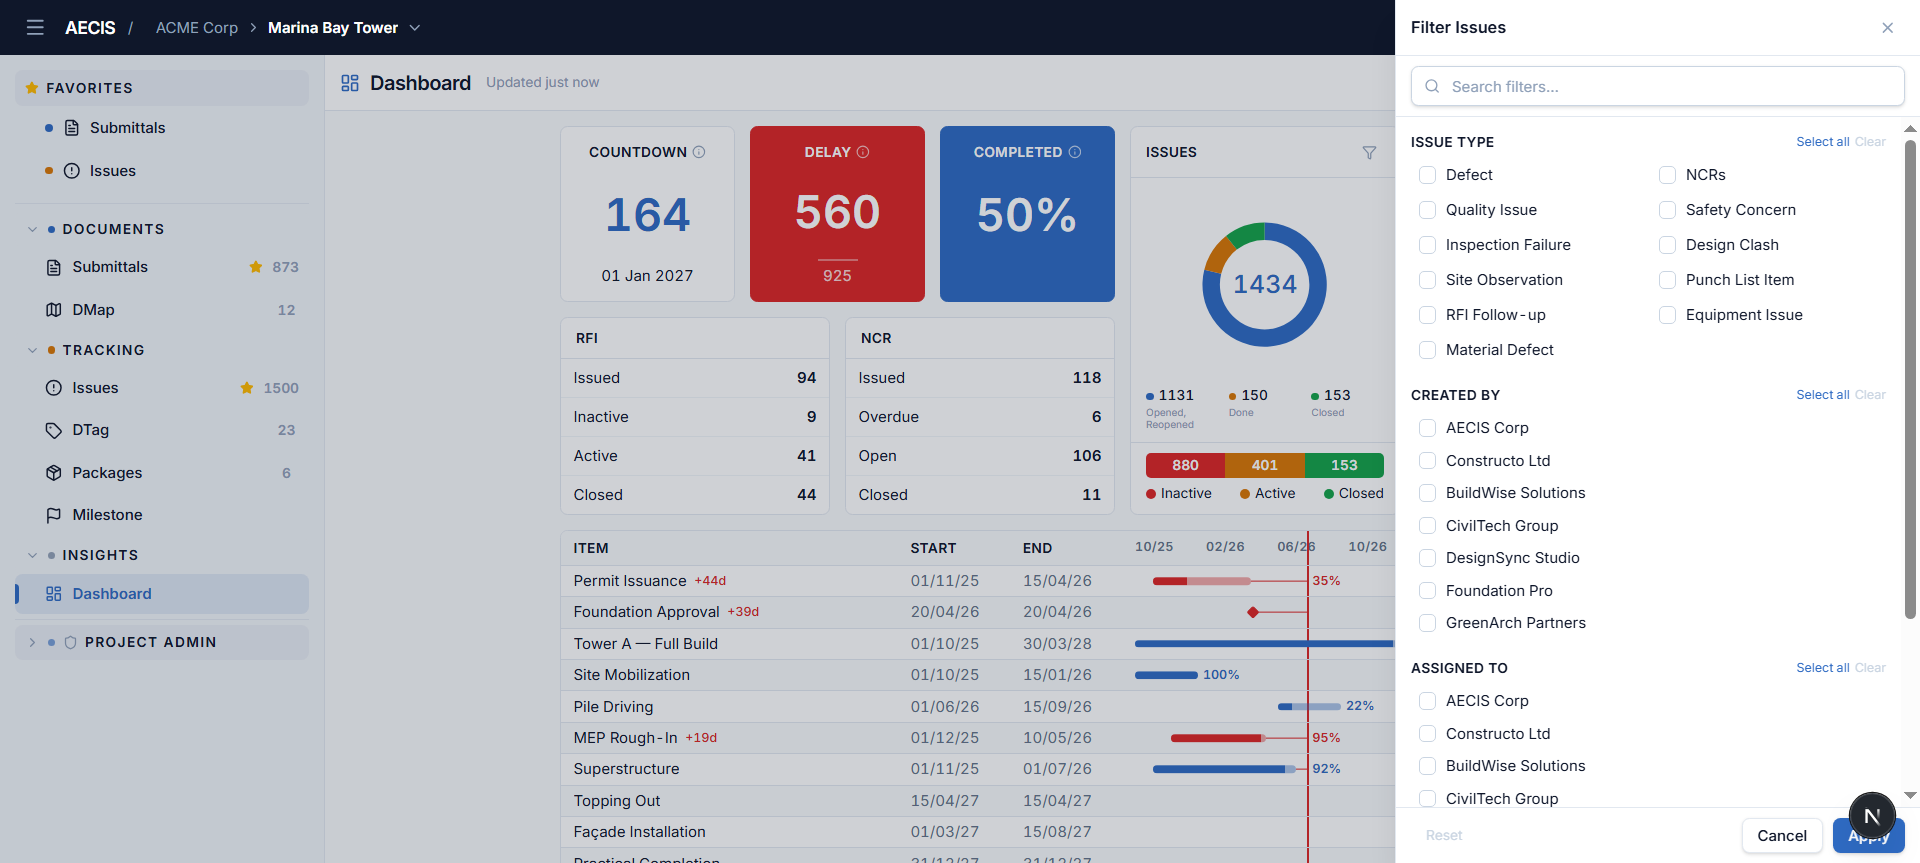
- Fields — a Type checkbox grid, Created By (stakeholder of the creator), Assigned To (stakeholder of the assignee), and a Date Range. The search box filters all checkbox lists at once.
- Actions — Apply commits and closes; Reset clears; Esc or clicking the backdrop cancels.
- Filters persist per project (Issue and Submittal separately) and survive a page refresh.
- An active filter narrows the donut — but the lifecycle stacked bar stays global, always reflecting the full dataset.
Drill-through
Every clickable number opens the matching module list with the corresponding filter pre-applied:
| You click | You land on |
|---|---|
| A donut slice or legend dot | The module list filtered by that status — plus the chart's active filter, so the list shows exactly the records behind the number |
| A stacked-bar segment | The module list with the Lifecycle filter (Inactive / Active / Closed) pre-selected in its Filter panel — lifecycle only, without the chart filter, matching the global bar |
The same Lifecycle criterion is also selectable manually at the bottom of the Submittal/Issue Filter panel, and the counts always match the dashboard bar.