Dashboard Module — Overview
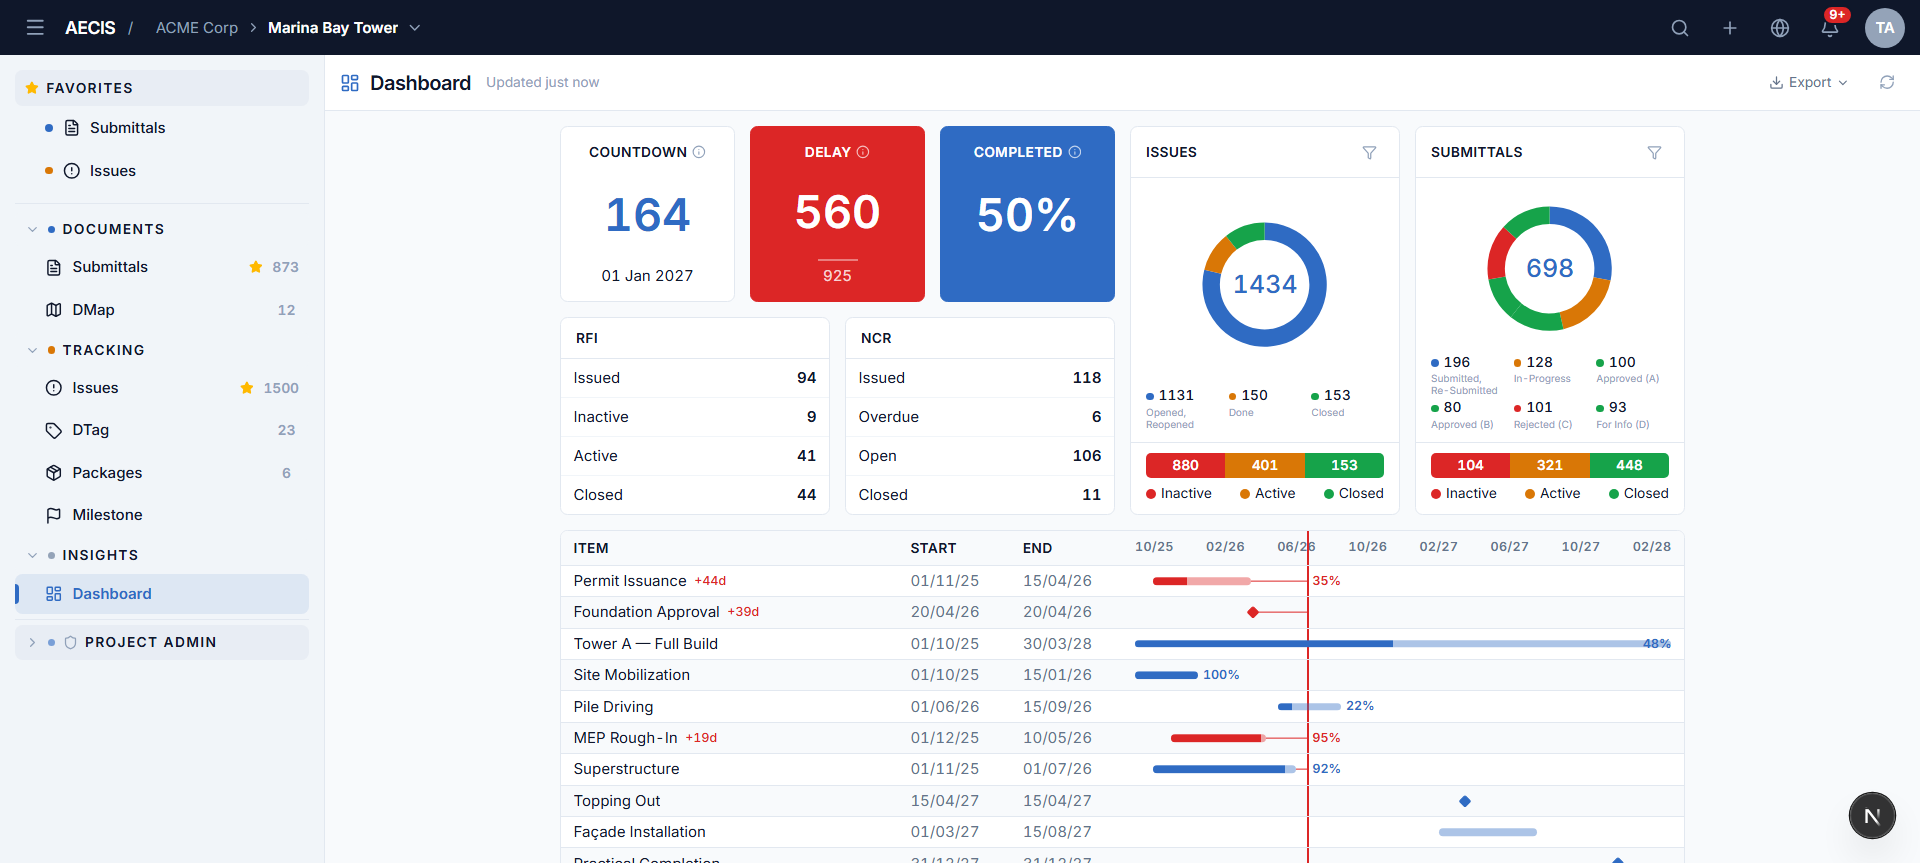
The Dashboard gives the project team an at-a-glance overview of project health on one screen, composed of independent widgets: three KPI tiles (Countdown, Delay, Completed %), the Submittal and Issue status charts, the RFI and NCR summaries, and a Milestone timeline. Every number on the board can be clicked to drill into the matching module list.
You will find it in the Insights group of the navigation sidebar.
Layout
- Header — the title, a "Updated N minutes ago" caption, an Export menu, and a Refresh button.
- Board — a one-screen layout: the KPI trio over the RFI / NCR summaries on the left, the Issue and Submittal donut charts on the right, and the Milestone timeline spanning the full width below. On phones the board falls back to a single scrolling column.
An administrator can rearrange the board — order, visibility, and layout style — in Dashboard Settings.
Widgets are independent
Each widget loads on its own: while loading it shows a skeleton, on failure it shows an inline message with a Retry button that refetches only that widget. One failing widget never blanks the whole dashboard.
Permissions
Widgets are gated by your module read permissions:
| Widget | Requires |
|---|---|
| Submittal chart + RFI summary | Submittal read |
| Issue chart + NCR summary | Issue read |
| Milestone timeline + the Delay KPI | Milestone read |
A widget you cannot see is replaced by a permission placeholder; the rest of the dashboard renders normally.
Data freshness
- Auto-refresh — all widgets reload every 5 minutes.
- Manual refresh — the header button reloads everything in parallel.
- Last updated — the header caption shows how long ago the data finished loading.