KPI Tiles
Three headline tiles sit at the top-left of the board. Each has a label, a value, an info tooltip (ⓘ), and an inline edit affordance. They are headline metrics — clicking them does not drill through.
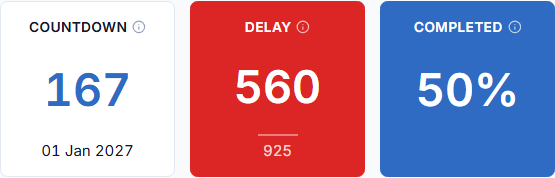
| KPI | Meaning | Source | Tone |
|---|---|---|---|
| Countdown | Days remaining until the Grand Opening date, with the date in the caption | Manual — enter the Grand Opening date | White card, blue number |
| Delay | Schedule slip in days (the block color carries the sign — no +/− shown). The caption under the divider shows the project duration | System-computed (latest milestone end − Grand Opening date); a manual override wins | Solid block — green ahead/on-track, red behind |
| Completed | Overall completion percentage | Manual — entered by the PM, not system-calculated | Solid blue block |
N/A until entered
There are no fabricated defaults. Until a value exists, a tile shows "N/A" in a slate tone — Countdown and Completed until the PM enters them, Delay until a Grand Opening date makes it derivable (or a manual value is entered).
Editing a tile
- Click the pencil on the tile. A full-width input opens (a date picker for Countdown).
- Enter or clicking outside commits; Esc cancels.
- Committing an empty field clears the manual value — the Delay tile falls back to its system-computed value, Countdown/Completed return to N/A.
Changing the Grand Opening date re-derives the system Delay so the two stay consistent.
note
The Delay tile needs the Milestone read permission — without it, the tile shows N/A.